Getting Started “Tools / Options”
“File / Start Trace” Start tracing
“Edit” Data Management
Quick Help on UDS.
Data Management Example
“Filter”
“Filter”Applying Filters
“Edit / Find”, “Edit / Find Next”, “Edit / Copy”
“Tools”
“Tools – Send CAN Message”
“Tools – Process DTC”
“Tools – Launch Modules”
“Tools – Search CAN ID”
“Tools – Play Log”
“Tools — Settings” Interface Options
“Tools — Settings” “Edit Mode”
“Help / Registration”
“Help / About the Program”
Getting Started (“Tools / Options”)
We recommend that you start work with the “Tools / Settings” section.

Go to “Settings”, select the required interface and type of the cable, then set the CAN bus speed and mask.
The mask sorts out the needed messages, all the rest will be hidden.
* — all symbols
7 — just symbol ‘7’
? — any single character
Start Capturing (Tracing) (“File / Start Capturing”)
After saving the settings, you can start capturing (tracing) (“File / Start Capturing”). To stop tracing, press “File / Start capturing” again (uncheck the box).
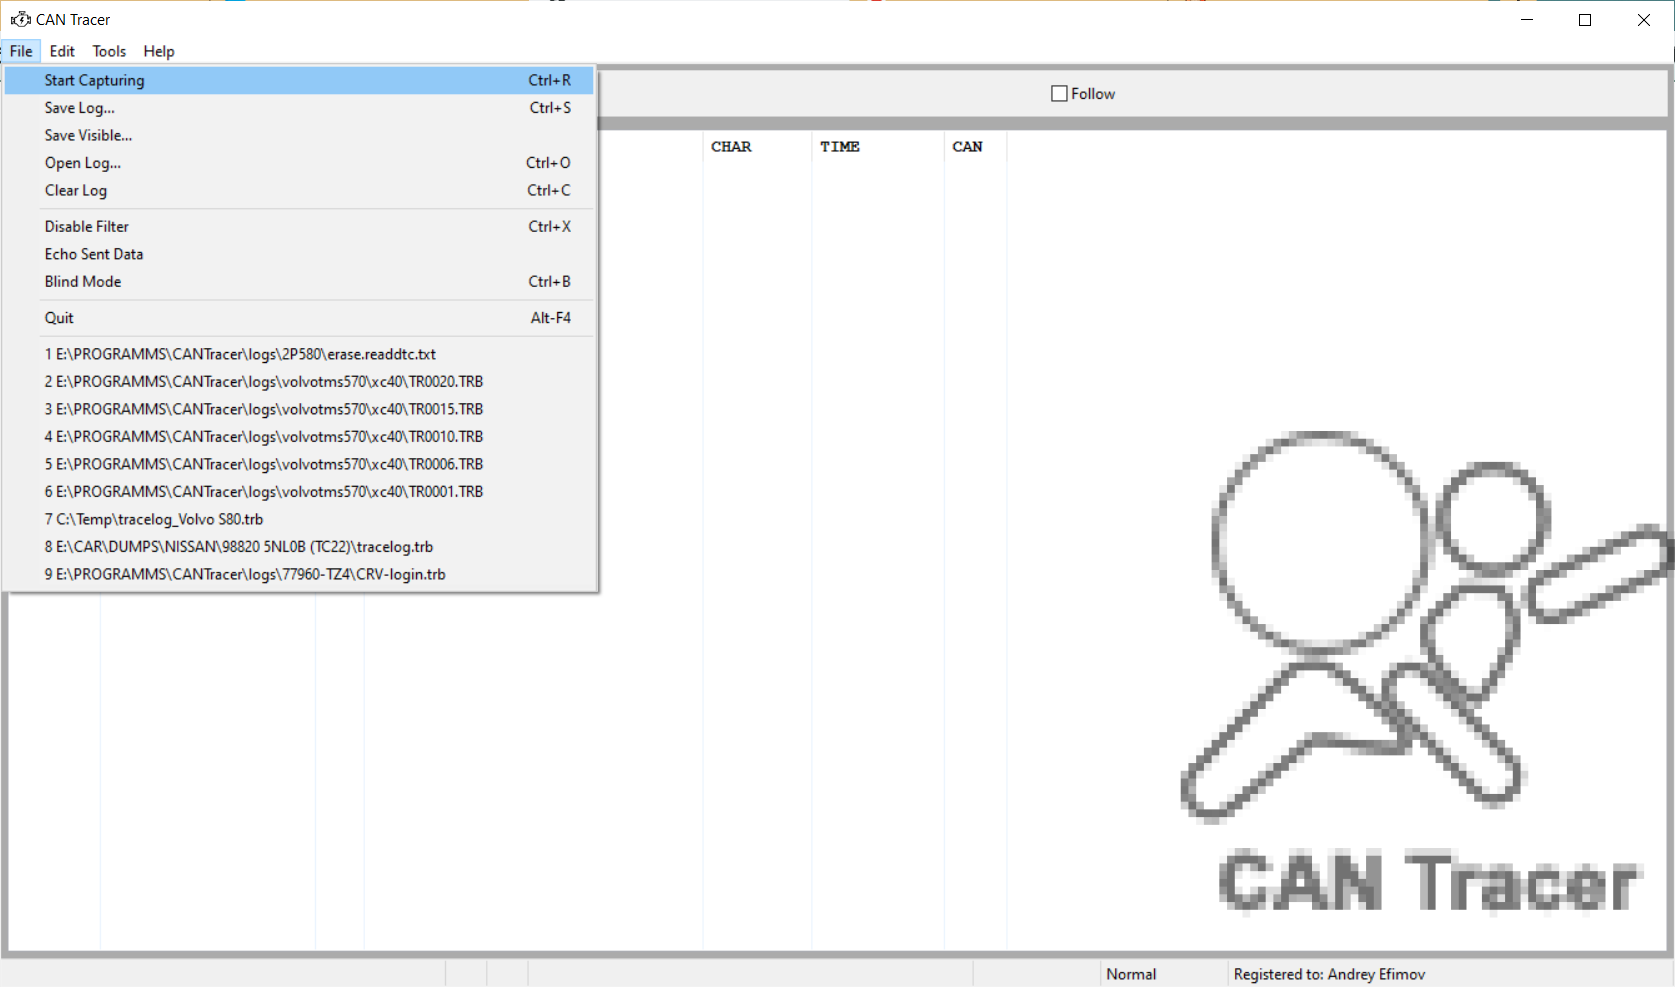
“File / Save Log” – save tracing results
“File / Save Log” – save tracing
“File / Clear Log” – clear the displayed messages.
“Cancel filtering” – reset the selected filter configuration.
“Silent mode” – reading the results without displaying the reading process. This mode is needed when dealing with “ultra fast” blocks or with an excessively large amount of data. In such cases, the table in the program GUI may be formed too slowly. Therefore, “Silent Mode” is used to speed up the process and get faster results. When the tracing is done, you can review and save the results.
Data Management (“Edit” )
The “Edit” menu comprises functions to manage data.

Quick Help on UDS.
“Show Quick Help on UDS” (Unified Diagnostic Services (UDS)): a double-click on a CAN Bus Log line will bring a popup window with relevant information (if available).
Data Management Example
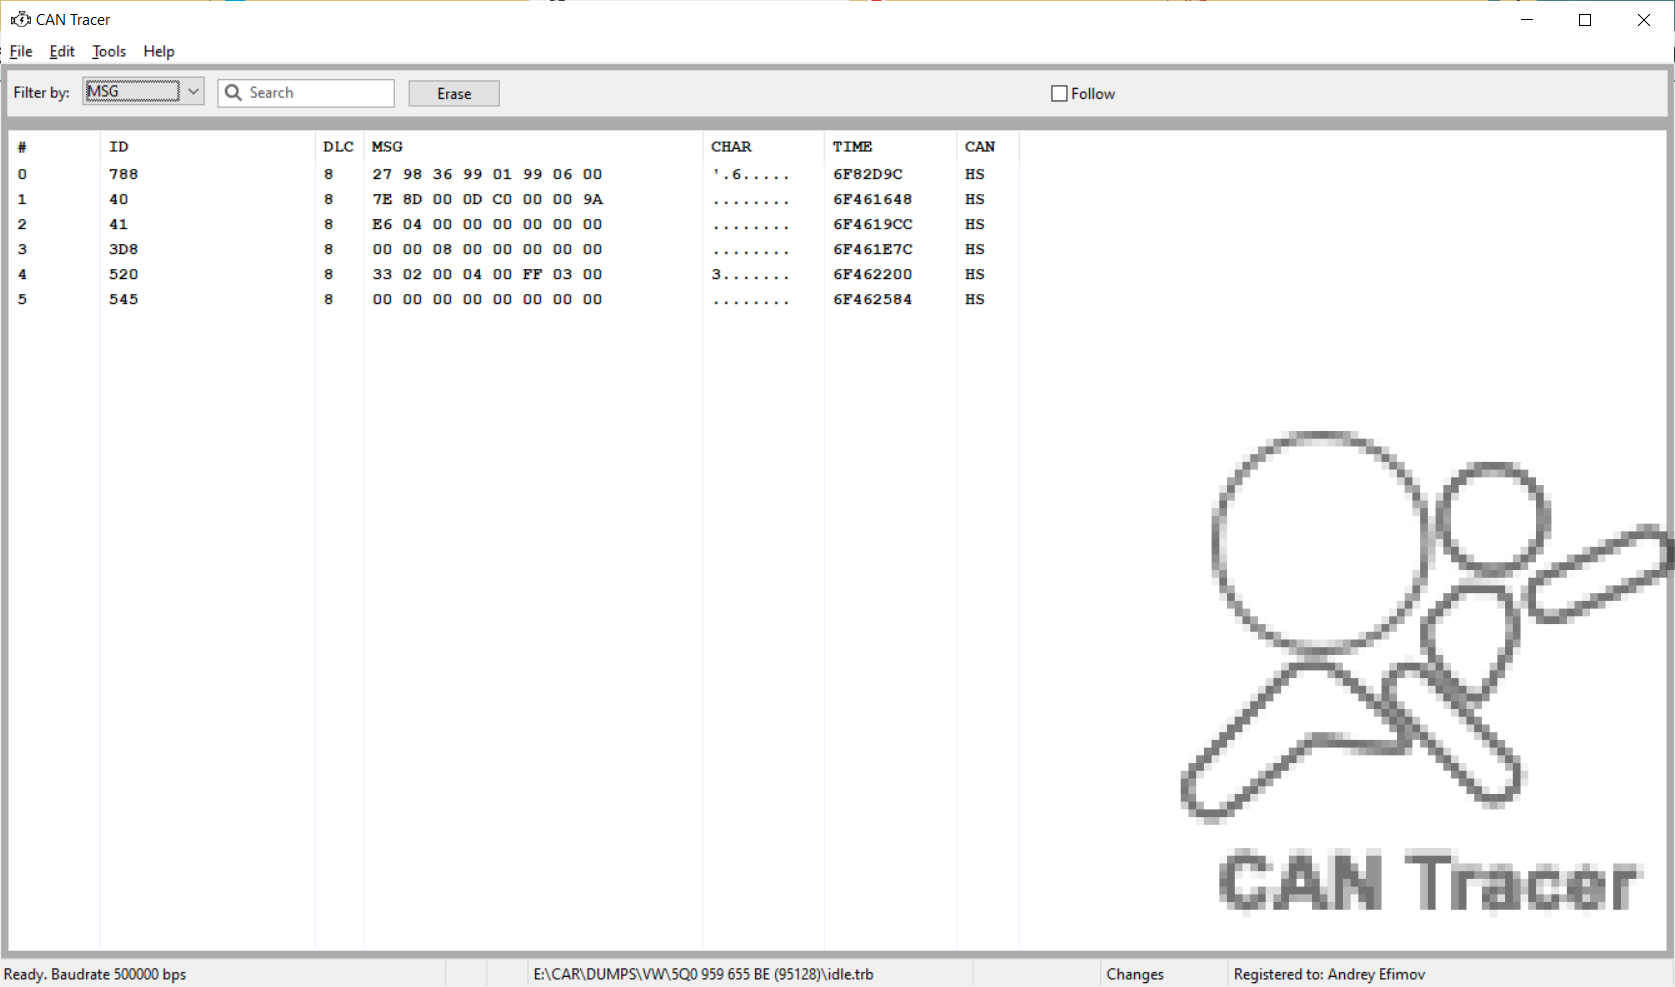
Guidelines for Data Management, a typical case: Upon finishing tracing or opening a saved log, we need to find messages from the 77F interface.
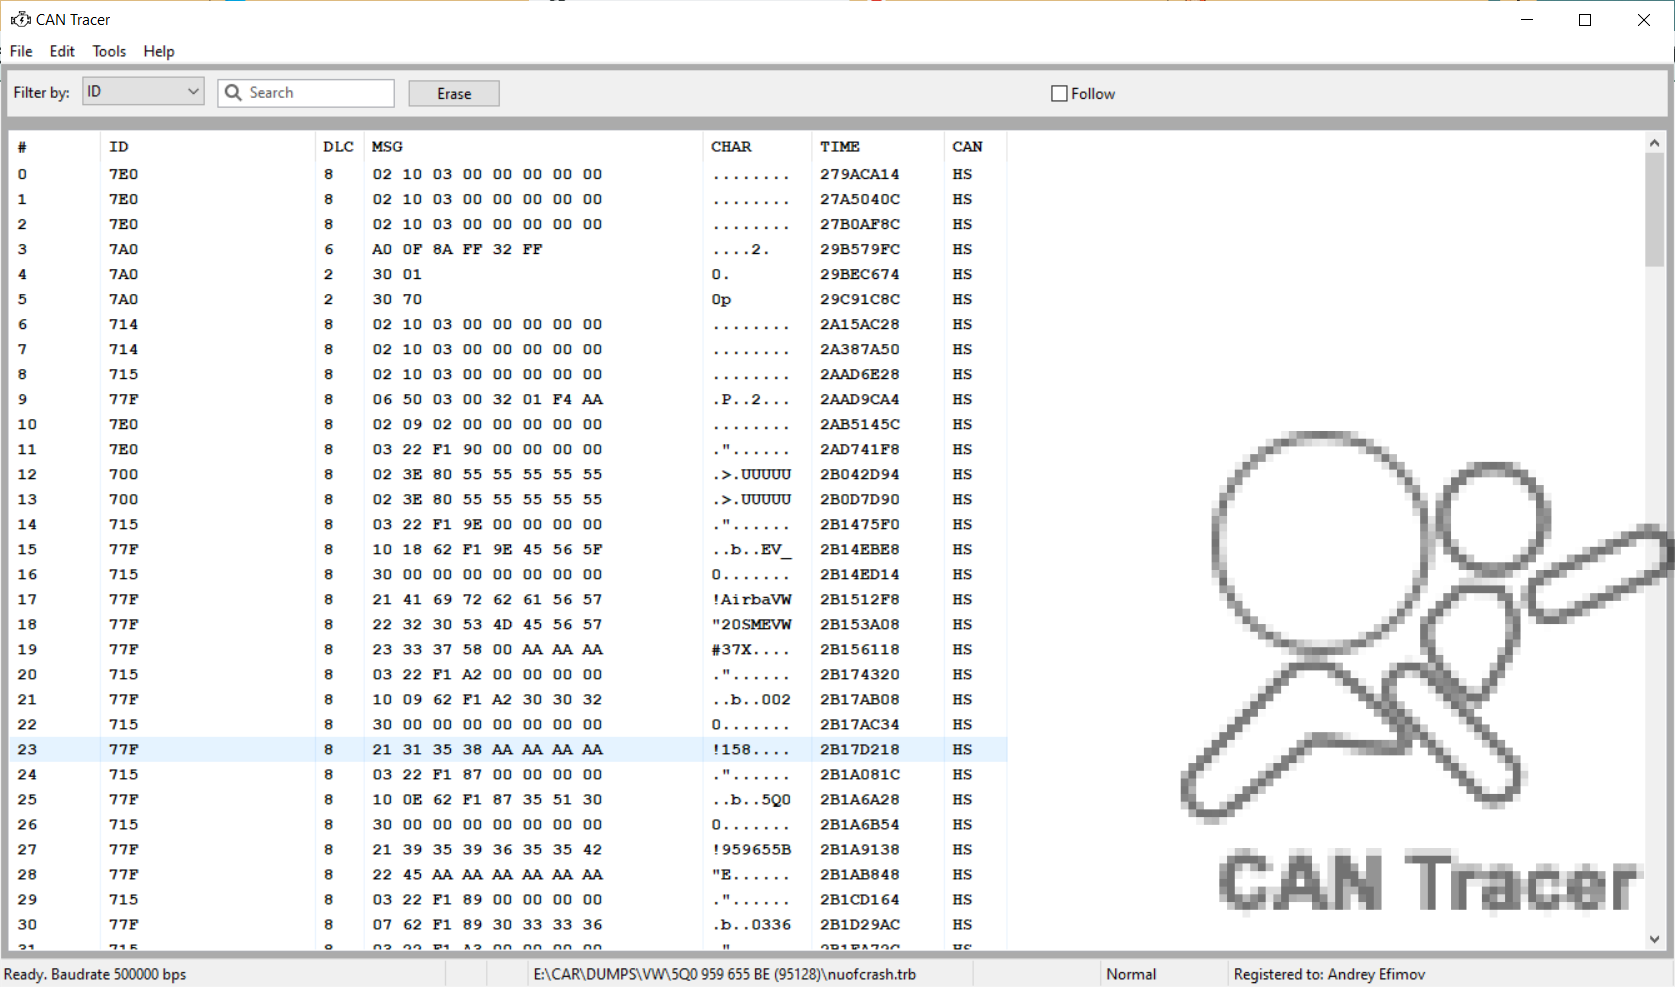
All the data are arranged in columns according to their type: Index Number (#), ID (interface identifier), DLC (message length), MSG (message itself), CHAR (character representation of the message), TIME (timestamp).
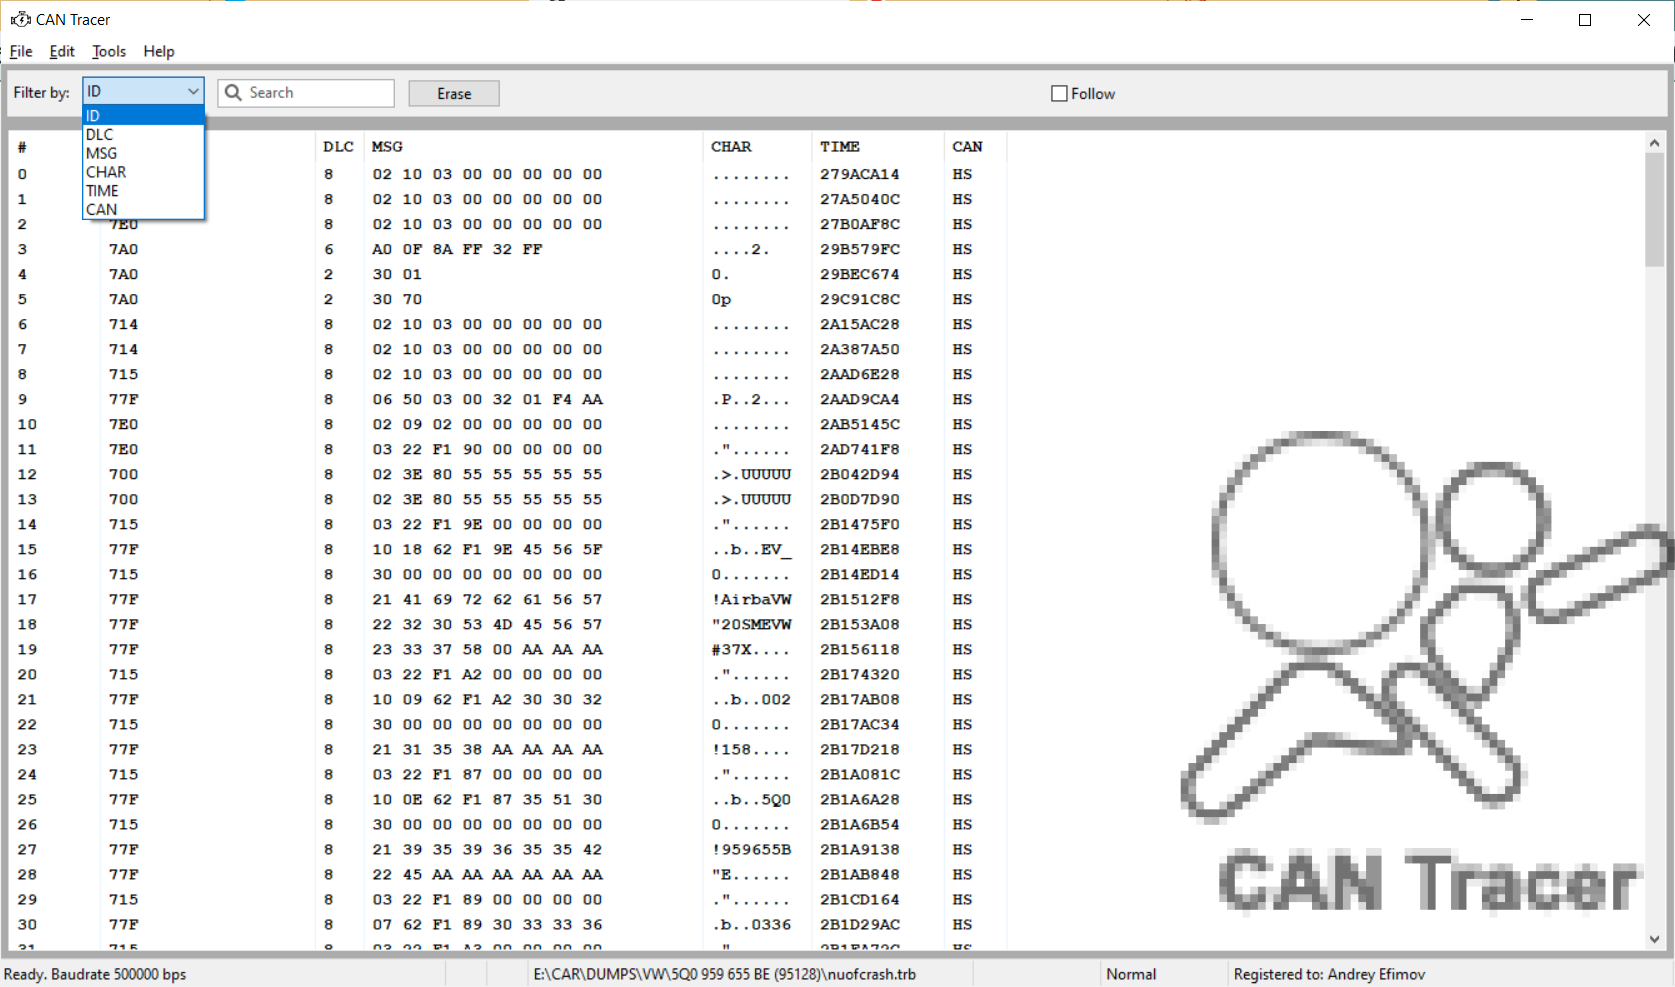
“Filter”
In the upper horizontal toolbar, select ID from the drop-down list, and in the search field, enter * 77F, then click on the “Magnifier” icon.
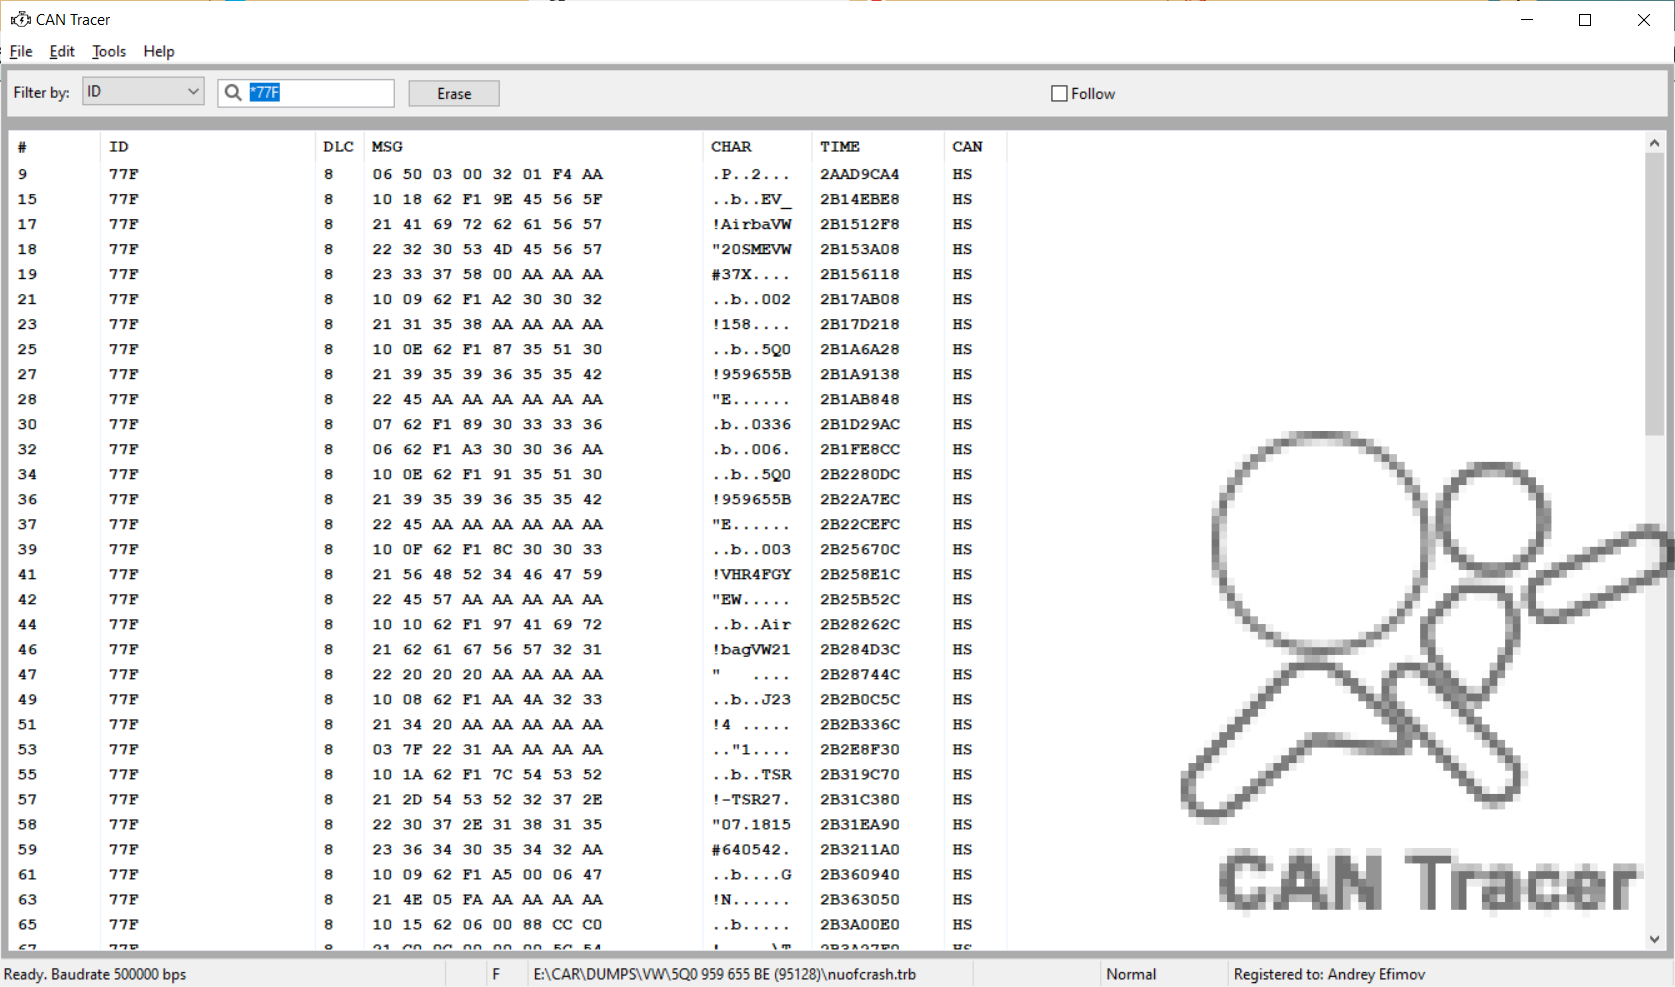
When pushed, the “Magnifier” button will initiate filtering, which will hide all the messages, except those intended for the 77F interface. You can cancel filtering by clicking on the Magnifier icon again.
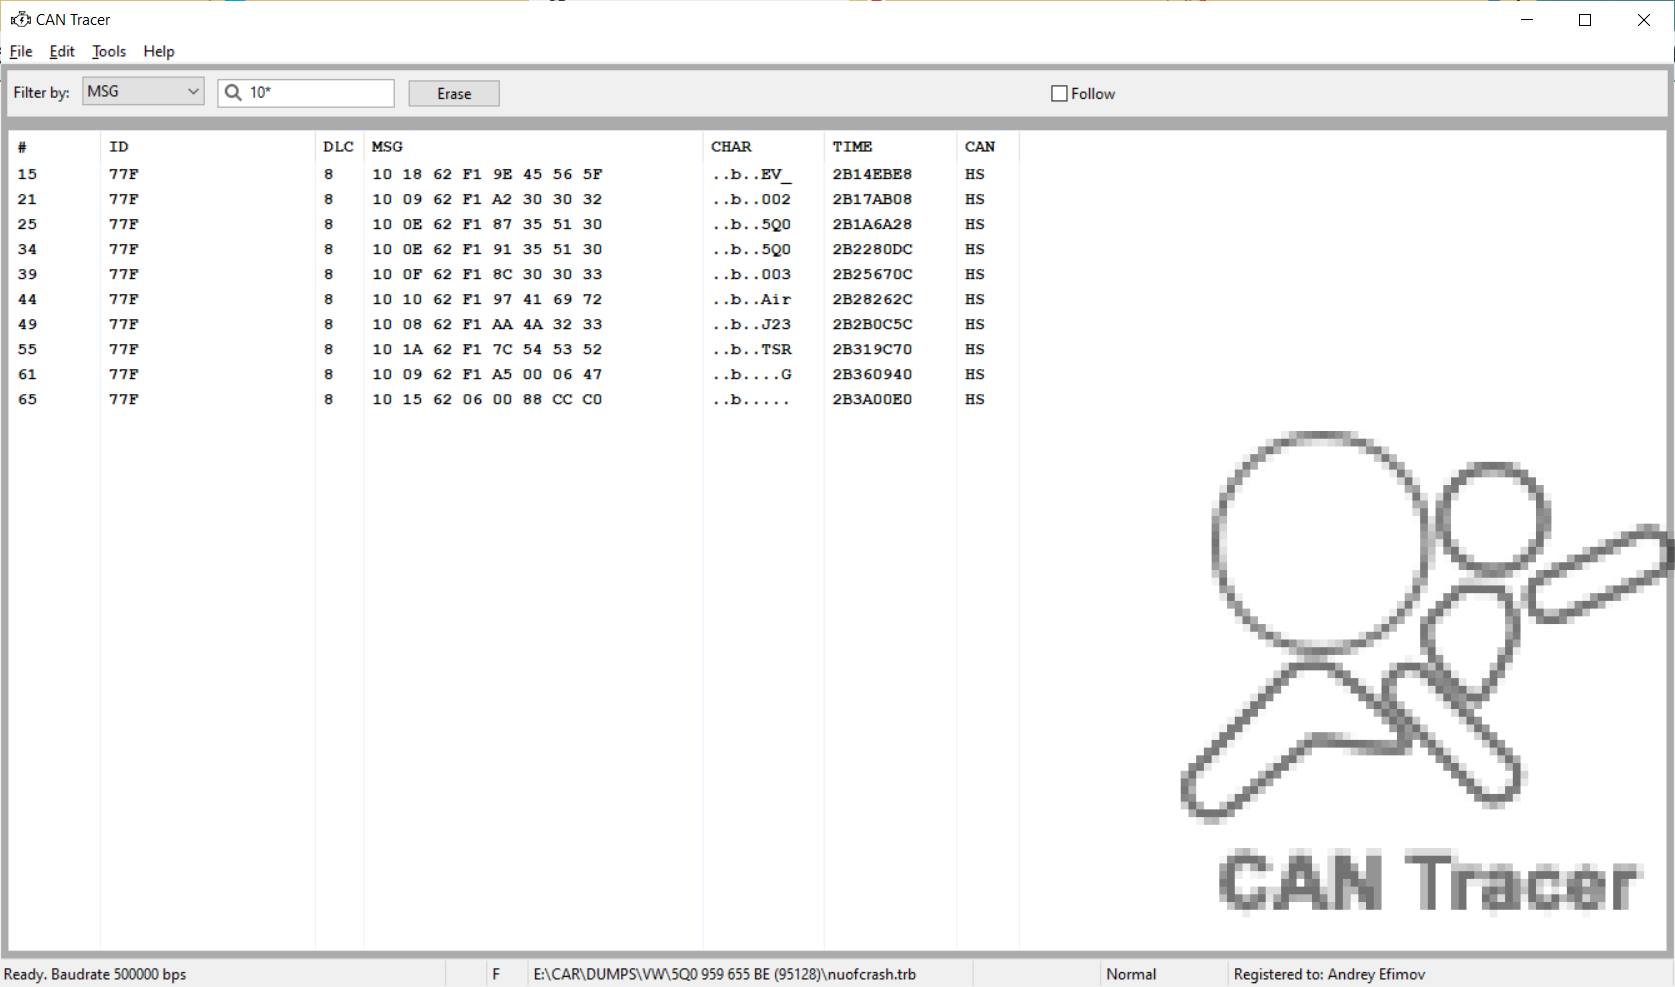
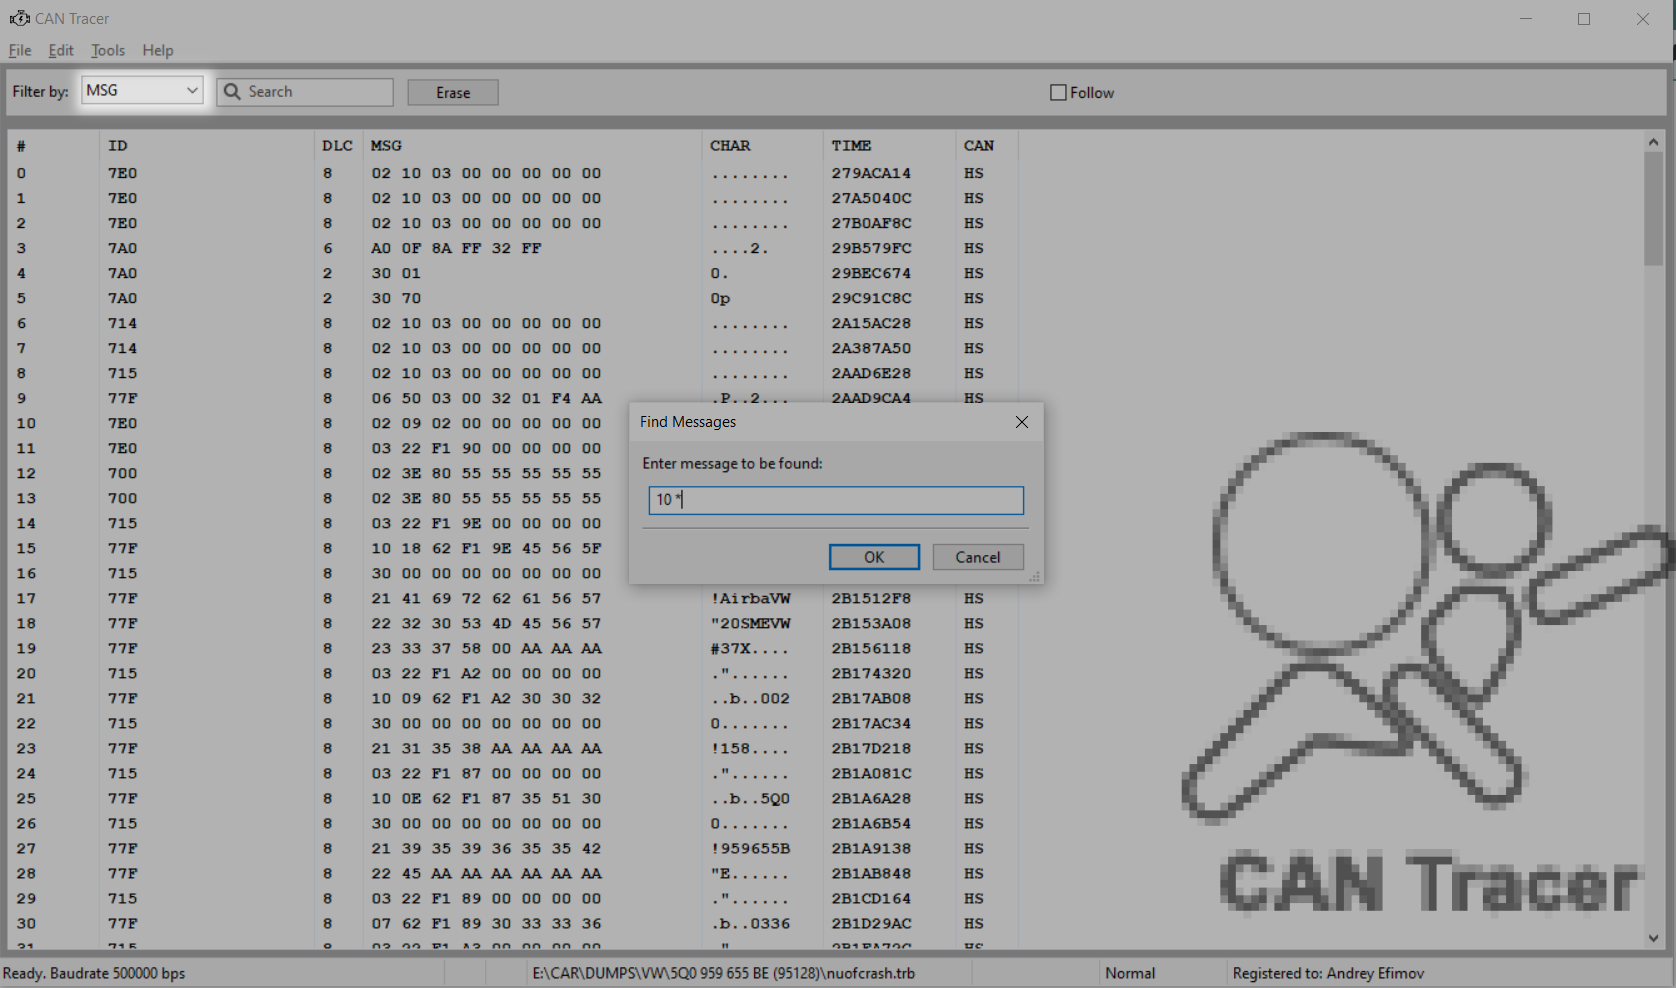
Now, suppose we want to find a message that starts at 21 02: In the upper horizontal toolbar, select MSG from the drop-down list, and in the search field, enter 21 02 * and click on the “Magnifier” icon to start filtering and hide all the messages, except those starting with 21 02.
Applying Filters (“Filter”)
A table interface allows you to apply filters by overlaying them.
Imagine that we’ve got the table, and now want to filter out all the IDs the start with “3” (see the picture). In order to filter out these messages, select “ID” in the upper drop-down menu, type in the filter “3 ??” , then click on the magnifier icon.
As a result we’ll get a filtered table, which is prompted by the letter “F” appearing in the status bar. Now select DLC and choose 4 (= Select all messages that are 4 bytes long).
This way we will find all the messages whose IDs start with 3 and that are 4 bytes long. To cancel the filter, leave an empty line – here the procedure is the same. Now it’s also possible to delete the selected items from the table. Previously, this could be done only by using filters or the “Delete” button, now the selected items can be deleted simply by clocking on the “Del” key or by selecting the corresponding item in the “Edit” menu.
“Edit / Find”, “Edit / Find Next”, “Edit / Copy”
The same principle is applied to “Edit / Find” – the search is carried out according to the combo box selected in the filter.
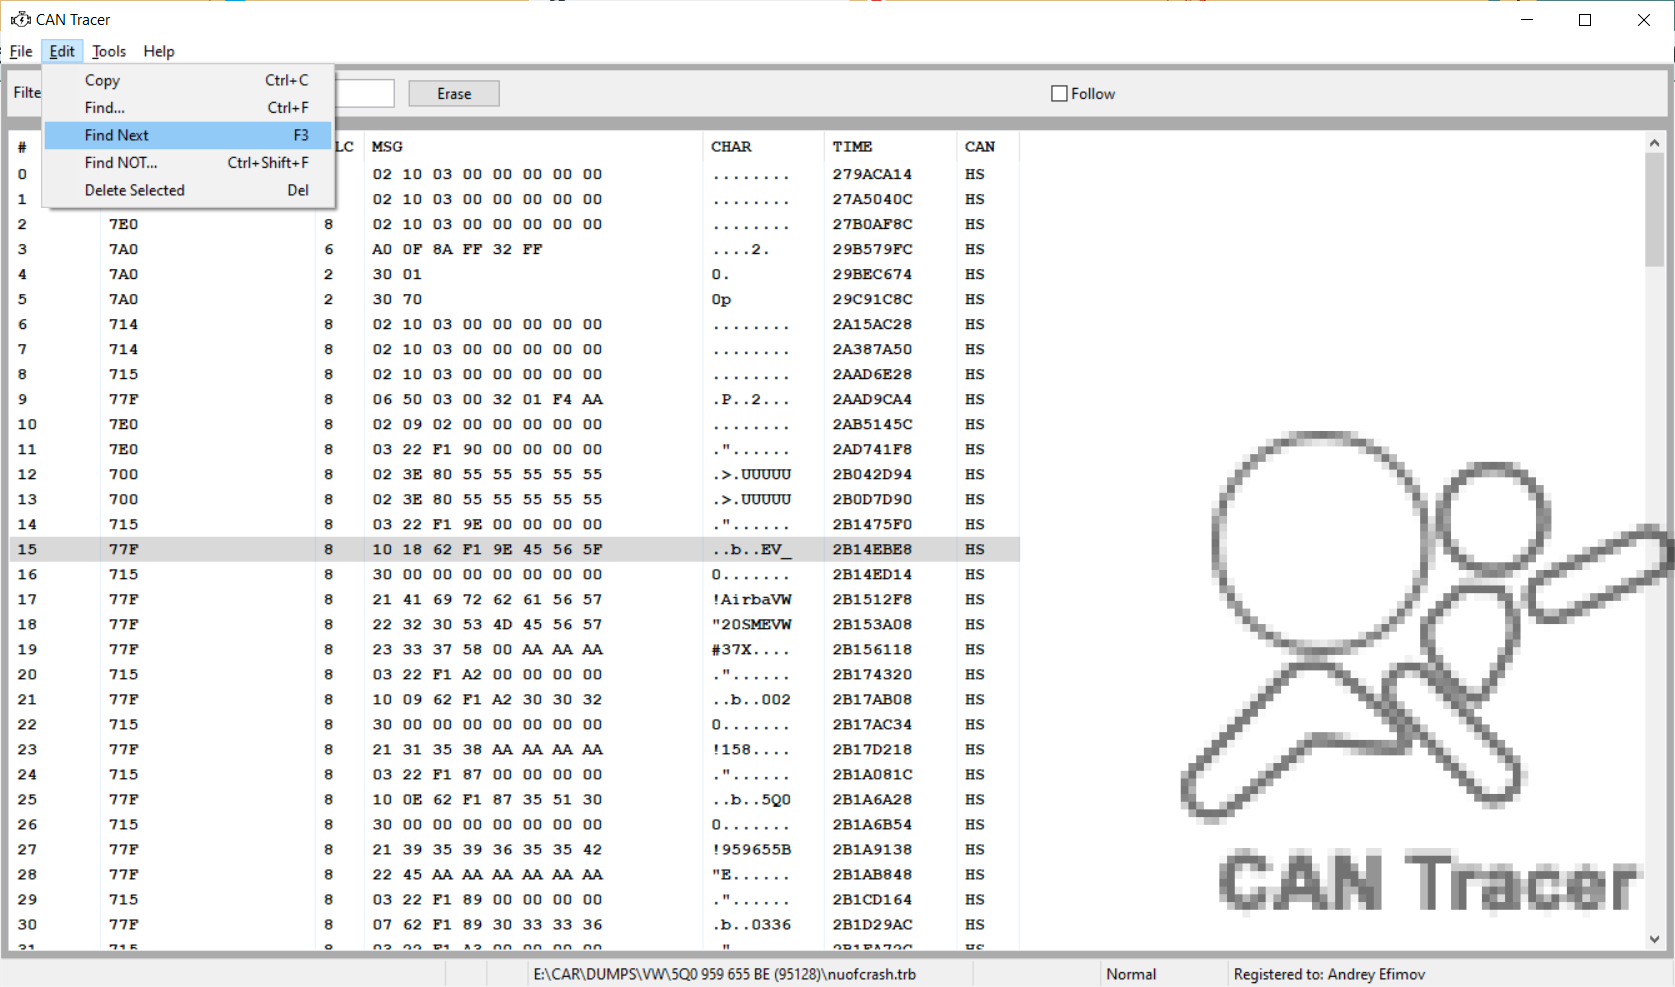
“Edit / Find Next” – searches for the next item in the table that meets the search criteria.
“Edit / Copy” – copies the selected line to the clipboard.
“Tools”

“Tools – Send CAN Message”
“Tools – Send CAN Message”
Allows you to send an arbitrary message to the CAN Bus and see the response to it. Specify in the drop-down dialog the CAN ID number (the one from which the message is sent) then type in the text of the message (the length will be calculated automatically). After that press “Send“.
Use multiple messages if needed. In this case, you will need to type in ?? instead of one or two bytes of the message, then set the “Start” and “Finish” parameters for the first two question marks, and “Start2” and “Finish2” – for the second ones. You should also specify a pause in the corresponding parameter, which will be used to separate messages when sending. The program will automatically sort out all the values for the specified bytes of the message, from Start to Finish (inclusive).
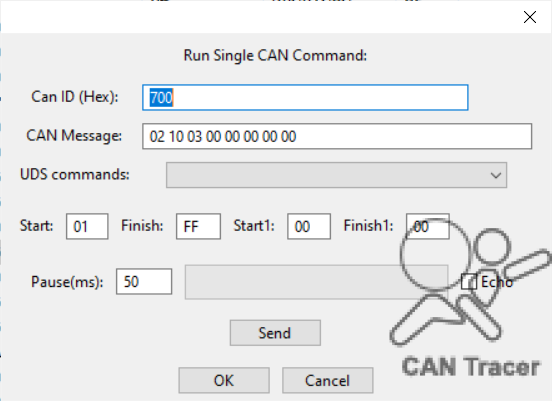
The “Echo” parameter is required for the cases, when the bus deletes the messages you send, and you still need them.
“Tools – Process DTC”
“Tools – Process DTC” – allows to identify errors by messages in the log. To search for an error, enter the CAN ID, as well as the line numbers at the beginning and end of the search fragment in the popup window.Use the OK button to save the entered parameters for the next search.
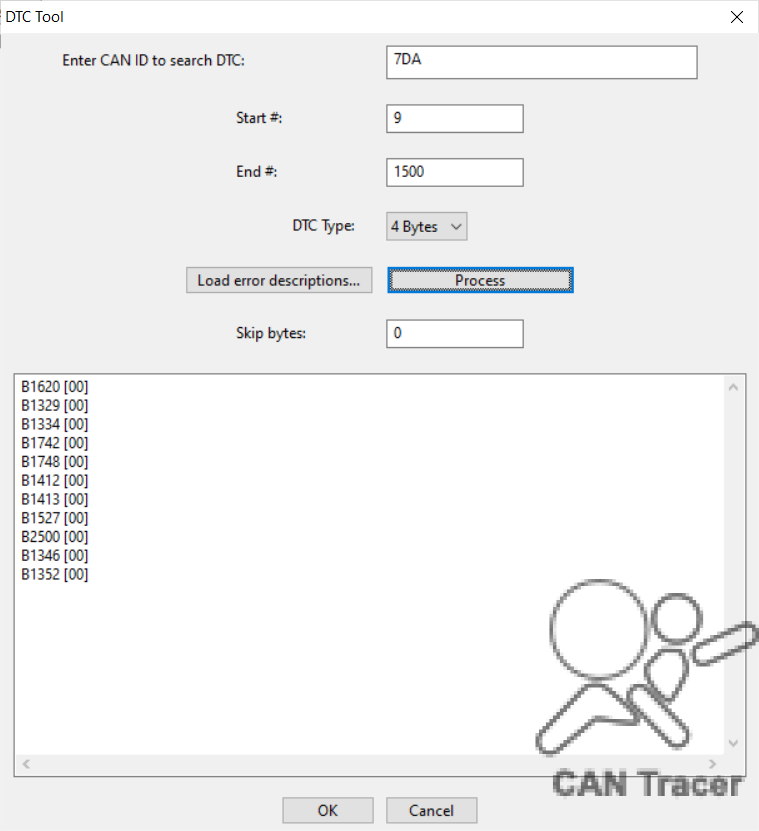
When the description file is loaded, see the interpretation of the error.

“Tools – Launch Modules”
“Tools – Launch Modules” – allows you to launch the module file. This tool basically allows you to open a module file (.ctp or .ctx).

Later, depending on the properties of a particular module, some extra functions may be enabled. The language and syntax for creating new modules are described in “Instructions for creating modules”.
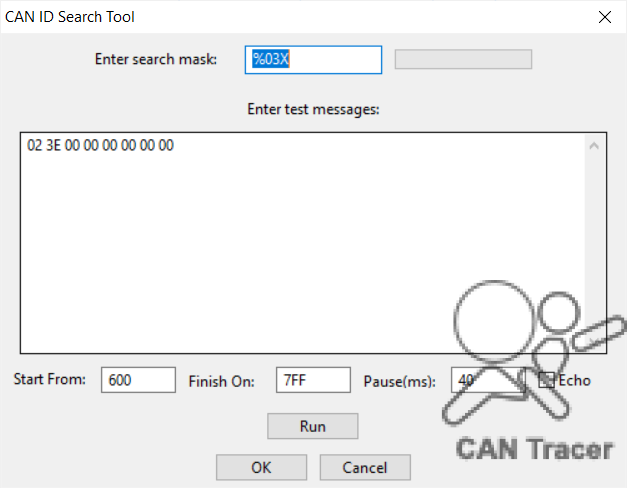
“Tools – Search CAN ID”
“Tools – Search CAN ID” – allows to send a message to the unit using a mask with specified parameters. See the response of the unit to assess the results of the the interface search.
“Tools – Play Log”
“Tools – Play log” – allows to run the saved and edited logs with specified parameters.
When the CAN Tracer writes a log (a file with CAN Bus messages obtained as a result of tracing), it can be saved. The saved log can be used for different operations. Clicking on the “Open Log File” button will bring up a dialog for opening a saved Log file in .txt or .trb format. Later, the data are loaded and displayed in the form of a table – now they are ready for actions.
You can play the entire log using the “Play All” button.
In some cases, it’s necessary to play only one message, for this purpose use the “Play 1 message” button.
The “Replay” button allows you to play again, and the “Skip” button – to skip the message.
Use the Back button to go back to the previous item, and the Rewind button to return to the beginning.
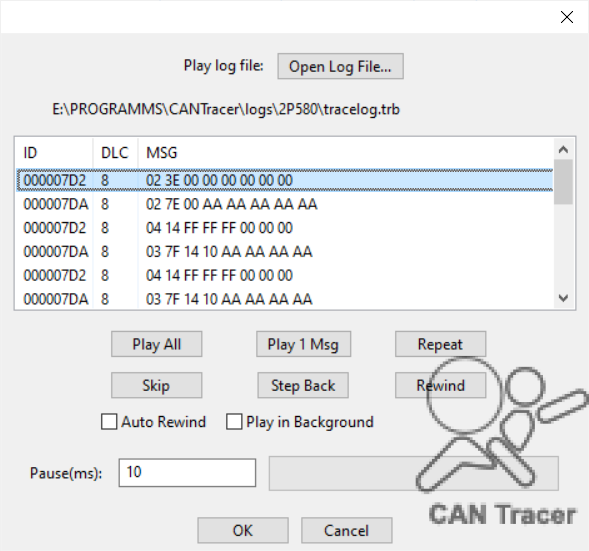
“Looping” – an ability to continue replay upon reaching the end of the log. This option is applicable in two cases: 1) when the “Play All” button is used; 2) when the “Background Mode” is selected.
The latter needs some detailed explanation: The point is that many ECUs, when launched in the “desktop mode”, show irregularities in performance, as compared to their stable work in the car. In many cases, this is due to the lack of messages from other control units of the vehicle – hence they persist only in the non-activated mode. Now that you’ve got a car CAN Bus log, you can run it in the background and the unit will regard it as a “proper” in-car mode. This function is activated after closing the dialog box by clicking “OK”.
In this mode, you can continue to work with the program as usual – launch modules, send CAN messages, etc. The only exceptions are the “Search CAN ID” and “DTC Decoding Tool” functions, which require the message tracing to be stopped.
The “Pause (ms)” field allows to set a pause between playing messages.
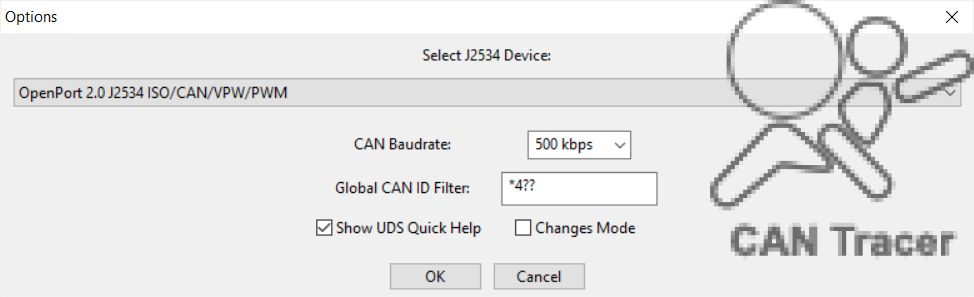
Interface Options (“Tools — Options”)
“Tools — Options” allows to select the interface of J2534 devices registered on the computer; “CAN Bus Speed” allows to set up the performance speed of all CAN bus operations ; “Global CAN ID filter” is an ID filter where you can use wildcards: an asterisk (*), and a question mark (?). It is possible to use multiple IDs separated by commas.
Edit Mode (“Tools — Options”)
You can also use the Edit Mode (found in “Tools – Options”). In this mode, the program displays only changes of messages from different interfaces (CAN bus IDs). In some cases, this mode is much more convenient for message analysis than dealing with the full log. When in edit mode, you can also view old records saved in trace files (.txt or .trb). It is important to note that the edit mode is just a display mode, while the trace file is still fully written, with all the received messages (as specified by the filters). The status line displays the mode type (“Normal” or “Edit”).
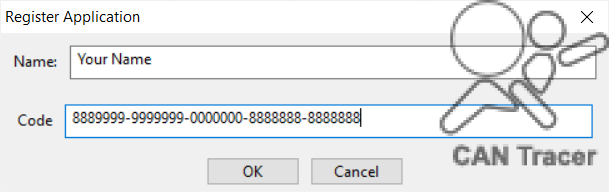
“Help / Registration”
“Help / Registration” – contains information about the device ID required to register the program.
“Help / About the Program”
“Help / About the program” – general information about the program. Also includes information about the computer ID, needed to be sent in order to register your copy of the program.